Measuring Audio Quality
We chose RightMark
Audio Analyzer 5.0 to conduct signal analysis of the Nehemiah,
comparing it to an EPIA 800. Classic EPIA results were almost
identical, as were other EPIA M results, so these have been
omitted for clarity. This is to be expected - the Classic
EPIAs all use the VT1612A
audio codec, whereas the EPIA Ms all use the newer VT1616
audio codec. The boards also have different layouts - important
as the placement of components such as amplifiers and capacitors
can affect audio quality.
RightMark Audio Analyzer works by playing
known test signals through the output of a soundcard, and
recording it at the input of the same soundcard. By comparing
these two signals, it spits out results for Frequency Response,
Noise Level, Dynamic Range, Total Harmonic Distortion &
Noise (THD+N), Intermodulation Distortion (IMD), and Stereo
Crosstalk. And nice graphs.
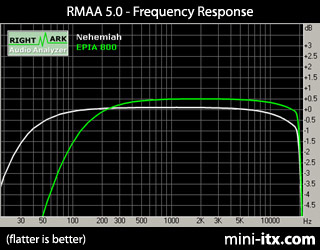
Frequency Response
Frequency response is the measure of signal
level as frequency varies. A perfect graph would be flat at
0dB for all frequencies, but in practice most human ears are
sensitive in the 40Hz - 15kHz range, and are sensitive to
about 1dB, so +/-0.5dB variations are acceptable. In all the
graphs, the Nehemiah is shown in white, and the EPIA 800 shown
in green.
Both boards have smooth response curves, with
the Nehemiah showing more bass welly in comparison to the
EPIA 800, becoming responsive to -1dB at about 40Hz against
about 120Hz. Both boards had excellent top-end response, although
the Nehemiah stays flatter, for longer.
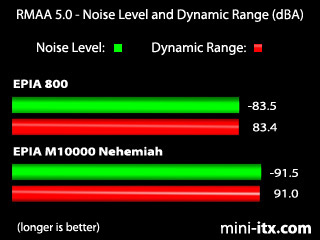
Noise Level and Dynamic Range
The Noise Level test estimates the level of
noise in a silent system, i.e. when no audio is present. We
inverted the graph here for clarity, as lower figures are
better. The Dynamic Range test applies a low-level signal
at -60dB and estimates the linearity (which is very important
for high-quality sound recording and playback).
The Nehemiah clearly has lower noise floor
and a bigger dynamic range than the EPIA 800. VIA claims the
Six-TRAC audio codec used in the Nehemiah can achieve a signal-to-noise
ratio of 97 dB when used on a sound card, and 90 dB in the
noisier environment of a motherboard.
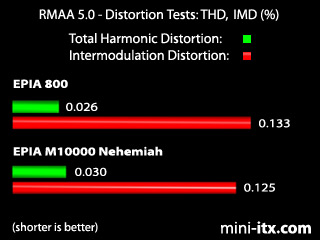
Total Harmonic Distortion and Intermodulation
Distortion
The Total Harmonic Distortion (THD) of a system
is measured by passing a 1kHz sine wave through the test chain
at almost maximal amplitude and measuring the amount of distortions
present at even and odd harmonics (multiples of the original
signal frequency) of the sine wave. The figure is given as
a percentage - the ratio of the geometric total of all these
harmonics to the power of the test signal. But this figure
alone does not paint a full picture - "even" harmonic
distortions generally sound warmer than the less desirable
harsh sounding "odd" harmonics. This is why tube
amplifiers can have a high THD and still sound warmer and
more "musical" than a transistor based amplifier
with a lower THD. This test shows distortions caused by a
test tone.
Intermodulation Distortion is a more complex
test, measured with two test tones (usually 15kHz and 16kHz),
that shows how multiple frequencies interact with each other.
An ideal result on a frequency analyser would show just the
two signals as peaks above the noise floor, but in practice
artefacts are produced at ratios of the original signal. This
test shows distortions that aren't present in the original
test tone.
Both the EPIA and EPIA M have similar
THD and IMD levels. Compared to current soundcards, their
THD is good, and their IMD is acceptable.
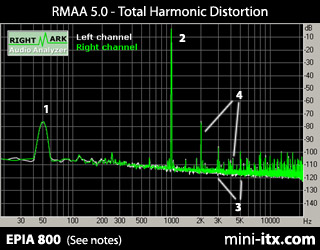
This is a typical THD spectrum plot. We've
marked some areas by way of explanation. Point "2"
shows the 1kHz test signal. Point "3" are the first
and second odd harmonics, at 3kHz and 5kHz. Point "4"
are the first two even harmonics, at 2kHz and 4kHz. Point
"1" is interesting anomaly - quite a large bump
at 50Hz. Our loopback cable was crossing the power cord and
picking up interference from our 50Hz mains power (we moved
the cable and ran the test again...)
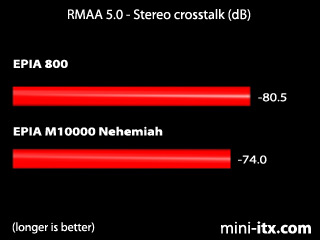
Stereo Crosstalk
Crosstalk tests how much signal energy bleeds
from one channel into the other. A test tone is played in
one channel, whilst the other muted channel is measured to
see how much crosstalk occurs. The test is repeated with the
channels reversed. We inverted the graph here again for clarity,
as lower dB figures are better.
This time the EPIA 800 fared better, allowing
less signal to bleed between the left and right channels.
In theory this should give it a better stereo image, though
in practice both results are good.
Multichannel audio on the EPIA Ms
VIA's "Smart 5.1" allows the Mic,
Line In and Line Out jacks on a motherboard be utilised as
6 channel surround sound audio outputs i.e. Front L/R, Rear
L/R and Centre/Subwoofer. If you only have 2 channel audio
content, you can enable "Magic 5.1" to simulate
6 channel audio (found in the volume control panel under rear
speaker/advanced). If by contrast you have 6 channel audio
content to playback, but only 2 speakers, you can use "DUALMAX"
to down-mix the audio in hardware.
Audio Listening Tests
We conducted extensive A/B Comparisons with
a Pioneer 454 DVD and the Nehemiah, using the same stereo
MP3 source material. We borrowed the use of a high quality
Yamaha amp and B&W speaker system for the task. Our conclusion
was that the standalone Pioneer had slightly more sub-bass
presence and stereo imaging, but there wasn't much in it -
we could only determine this after repeated listens. The Pioneer
also had the advantage of a digital cable. In our speaker
tests, the EPIA 800 gave a solid performance, perhaps lacking
slightly in the low-end welly that the EPIA M and standalone
DVD player had.
We next tried playing back some AC3
content using the S/PDIF port. Both boards gave similar audio
results to before, although the EPIA 800 didn't have the processing
power to smoothly playback the accompanying video.
Finally, we listened to material on the Nehemiah
and the 800 through a pair of high quality Beyerdynamic DT531s
headphones. This time, the difference was marked - the EPIA
M had a bass presence and clarity that the 800 simply couldn't
match. By comparison the 800 was thin and harsh sounding.
The M10000 also had much more volume available on the headphone
socket - we had to turn it down slightly.
Benchmarks
- Setup Details -->